Since Harold P. Freeman pioneered the concept of patient navigation in 1990, navigators have been searching for the best way to manage their patients. Navigators have developed very extensive spreadsheets to track their patients and their barriers to care. Some navigators have even spent significant time working with their hospital system’s IT in an attempt to get the basics built out in their EHR. They may still even use paper charts and calendars to help them manage their day. But why spend all of that time and effort when everything you need can be available in one location? In this blog post series, we’re going to compare documenting in spreadsheets, the EHR, and OncoNav so that you can decide which documentation platform would work best for you.
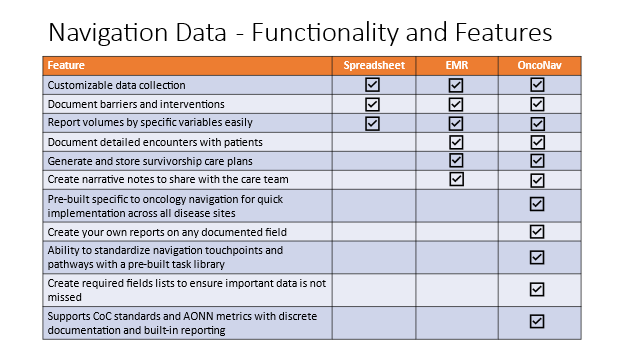
Comparison graphic
Customizable data collection
A navigator can customize the data they want to collect in a spreadsheet, the EHR, and in OncoNav.
A spreadsheet allows you to track any information about your patient, so navigators tend to individually customize the patient data they collect in spreadsheets. Since spreadsheets are not typically shared with other team members, it becomes difficult, if not impossible, to standardize data collection and reporting across a navigation program given the potential for varying degrees of knowledge by the navigation team around spreadsheets. The number and size of spreadsheets can quickly grow and become difficult to maintain.
Many EHRs can be customized to capture any data that you want to track. The EHR is one-size-fits-most, however, and is not geared towards oncology navigation. Customizing the data desired by a navigation program can take a significant amount of time by the navigation staff and the facility’s IT, who likely has no experience in or understanding of oncology navigation. This requires the navigation team to have an extensive understanding of the technical building of the EHR as well.
OncoNav was created by oncology navigators. It is designed to capture the data that is important for a navigation program while still allowing users to easily define and collect custom data specific to their program and community. Data customization can be done at any time by a designated OncoNav user without the need for IT or software development requests. The included Ad-hoc Reporting module in OncoNav also allows users to analyze and report on any custom data collected. Additionally, OncoNav Support is fully staffed by oncology nurse navigators who understand the complex world of oncology and navigating those patients and are available to help with customization at any time.
Document barriers and interventions
Assessing barriers to care and offering interventions to overcome those barriers are the crux of navigation. For years, navigators have used spreadsheets to track barriers and interventions for oncology patients. Now that EHRs are becoming more customizable, navigation programs are building out that ability in the EHR as well. Ensuring accurate reporting of that data can be nearly impossible. Documenting a barrier multiple times can inflate those numbers, but this is typically the only way to also track multiple interventions provided for that barrier through the continuum of care.
OncoNav includes those common barriers and interventions for easy documentation and tracking. We customize those to include what is pertinent to your facility and community. The barriers and interventions can be seen in one location with a full history for that patient to include which interventions were successful in helping that patient overcome the barrier and which ones were not. This allows the navigator to streamline their process by providing a quick view of interventions that they will use again if needed. Despite the number of times a barrier and/or intervention is documented, reporting can easily be filtered to show per patient, per disease type, per barrier, and per intervention. Ad hoc reporting in OncoNav allows you to get the exact data you need every time.
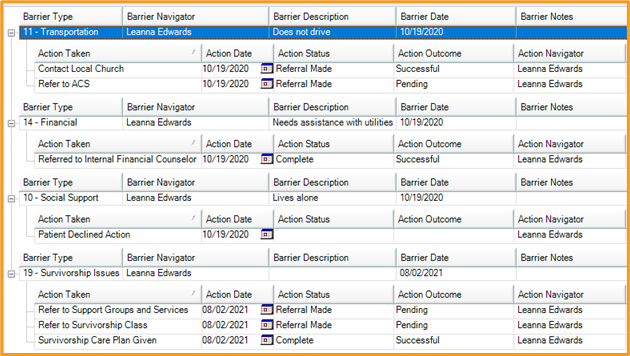
Barriers and Interventions in OncoNav
Report volumes by specific variables easily
Navigators that document in spreadsheets know the difficulty that is found when trying to report out a metric to the cancer administrative team. Unless someone is well versed in that spreadsheet software, reporting anything can be cumbersome, and the data may not be as concise as you want. For those that document in EHRs, reporting can be just as frustrating. Most EHRs have reporting built out by their local IT, and the navigator has little to no control on manipulating that report for additional information. The report typically arrives as a summary of data documented in the EHR but from an outside source with no direct connection to the EHR. Attempting to troubleshoot potential duplicate data becomes troublesome.
OncoNav provides several reporting options to include some common reports that are pre-built in the software, such as volumes and barriers to care, and others that are completely defined by the user. By only defining a data range, the user can quickly see each navigator and how many patients of each cancer type they are following. Additionally, ad hoc reporting in OncoNav is interactive with the patient’s navigation record, so the patient’s OncoNav record can be opened directly from the report to ensure the patient is being counted accurately.
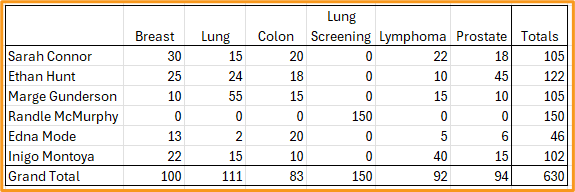
Ad hoc disease by navigator volumes in OncoNav
This series will continue in the next few weeks with a deeper dive into documentation and reporting with the EHR and OncoNav. For more information about oncology navigation documentation with OncoNav, please reach out to us at support@onco-nav.com. If you’re not a current client and would like to see a demo, please email us at sales@oncolog.com or click the link Schedule a Demo from the Onco website.

Oncology Data Management Software That Makes a Difference.
Enhance workflows while delivering quality information.